Insights · Accelerate plan

What are your visitors looking at?

Imagine what you could achieve if you really knew your visitors. The Insights dashboard turns visitor curiosity into data points that power better marketing and more informed masterplanning.

Available on the Accelerate plan

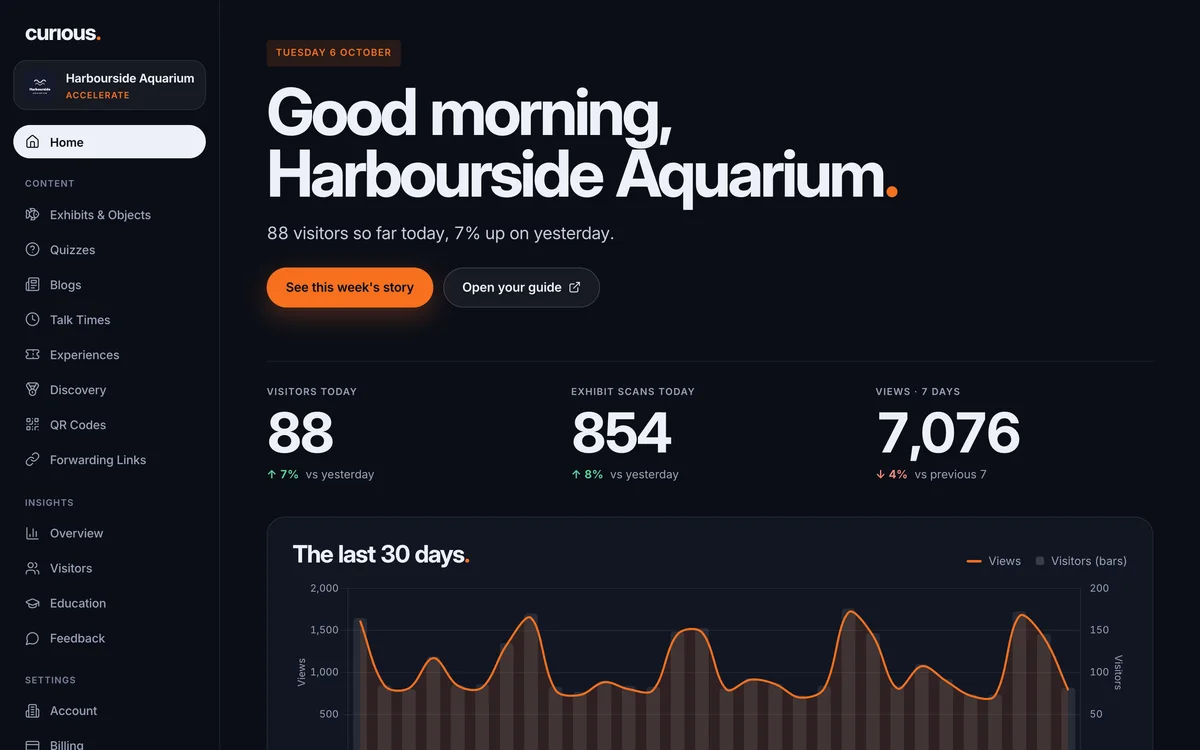
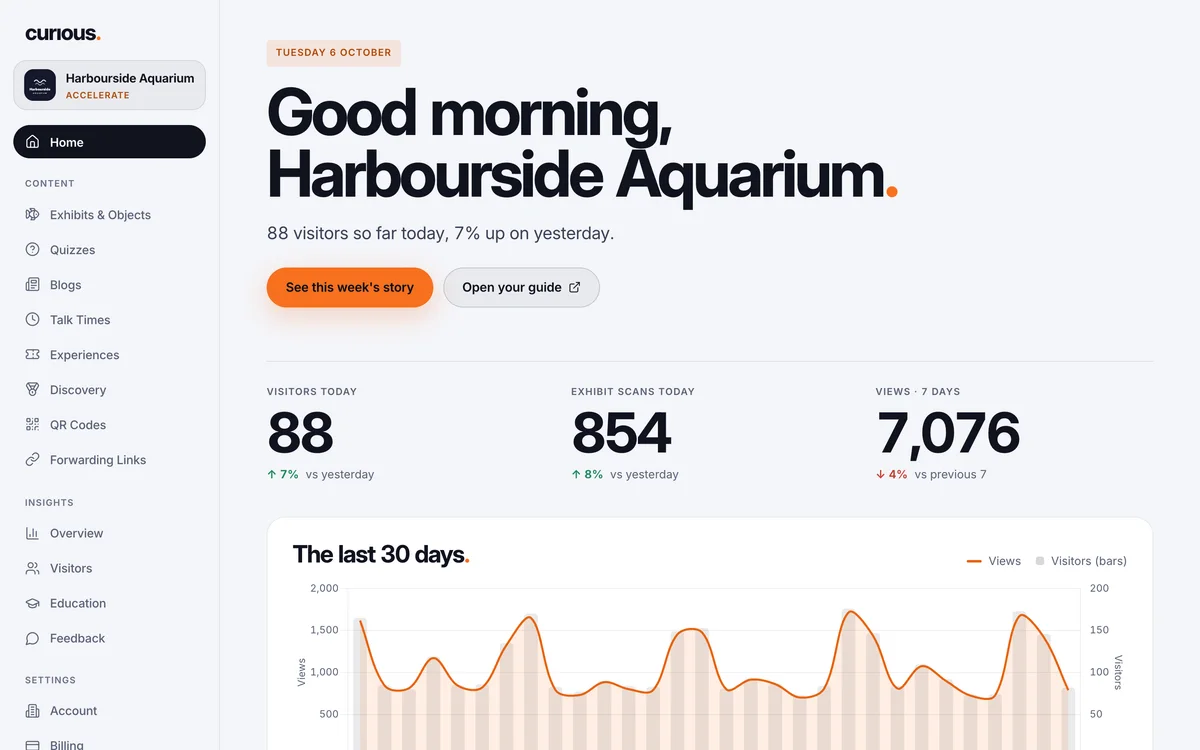
The portal's home page: today's visitors and scans, and the last 30 daysThe portal's home page: today's visitors and scans, and the last 30 days

The Overview, written for you.

  • The hard numbers, ready to review: visitors, views, scans per visit and more
  • This week’s story: the changes worth knowing, in plain sentences
  • A hall of fame: your busiest day ever, your record week and more
  • How you compare with other Curious sites, anonymously

What Insights tells you.

Pick a period, from today to all time, and every figure follows it.

Visitors view

When do they visit, and do they come back?

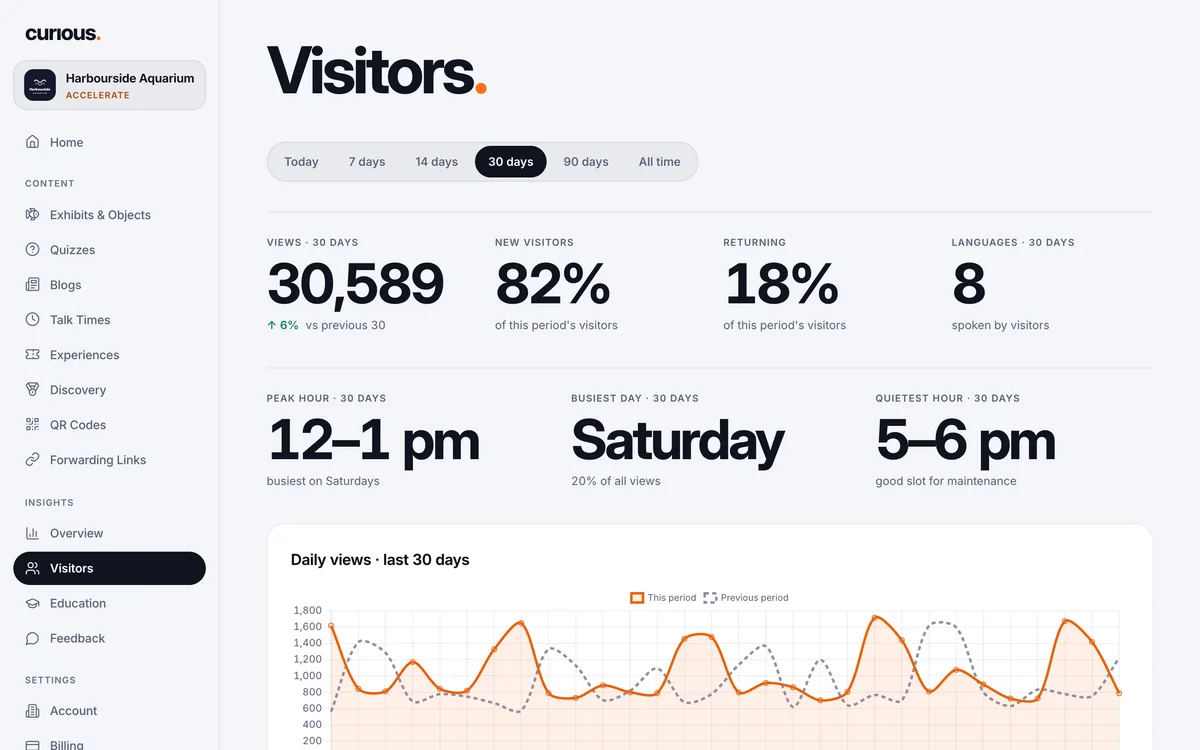
See how busy each day was against the period before, and how many visitors are new or coming back.

  • Peak hour, busiest day and the quietest hour, a good slot for maintenance
  • New and returning visitors
  • Where they arrive from: a QR code or the web
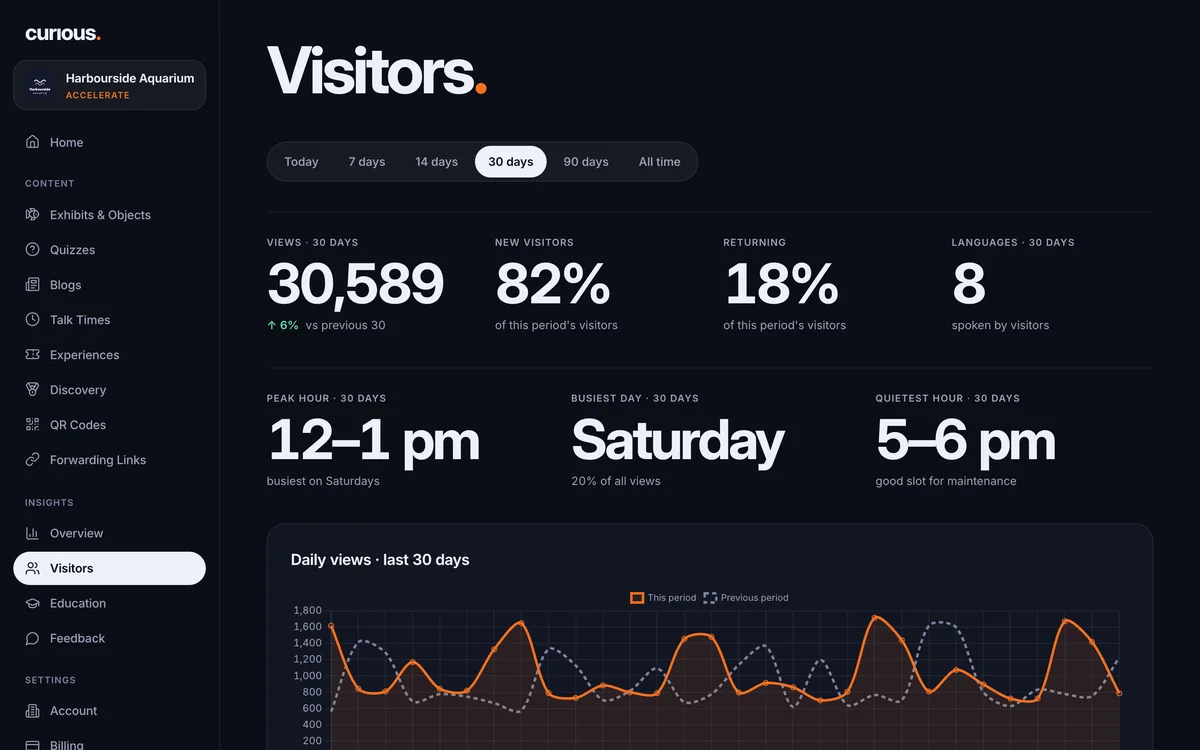
The Insights Visitors view: views, new and returning visitors, peak hour, busiest day, quietest hour and daily viewsThe Insights Visitors view: views, new and returning visitors, peak hour, busiest day, quietest hour and daily views
Visitors view · Journeys

How long do they stay, and where do they go?

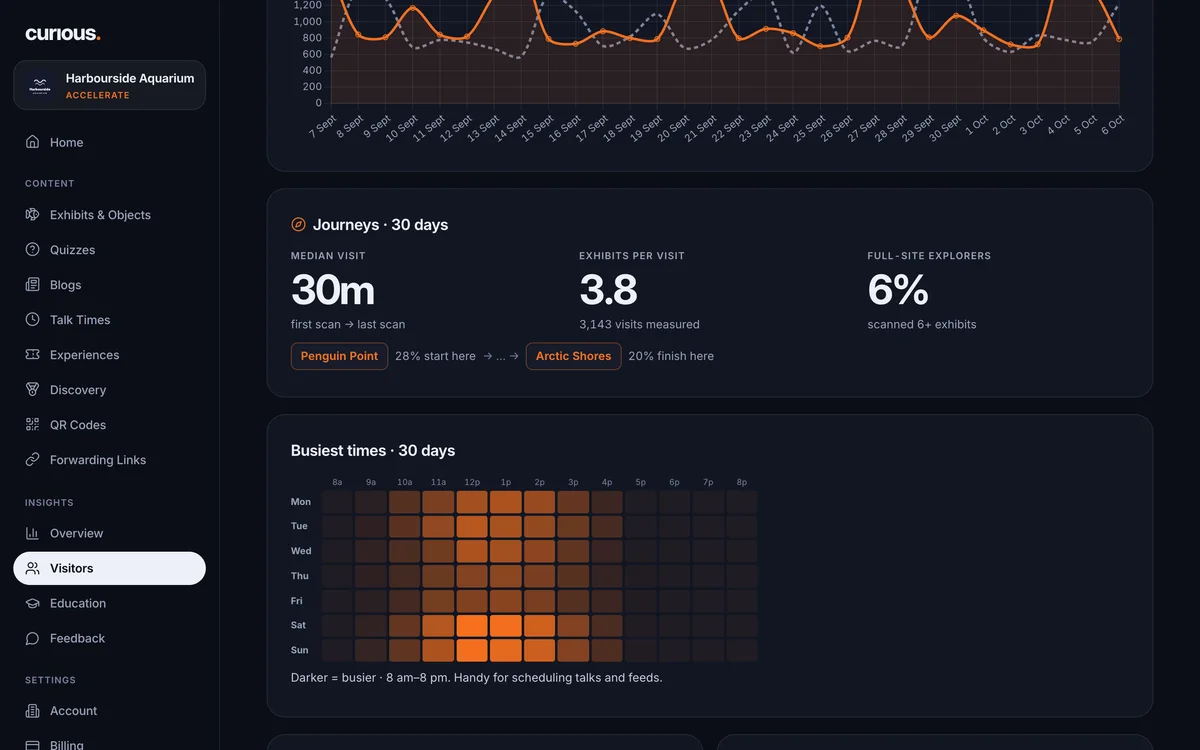
Every visit is followed from the first scan to the last, so you can see how long people stay and the route they take.

  • How long a typical visit lasts, how many exhibits it covers, and your keenest explorers
  • Where most visits start and where they finish
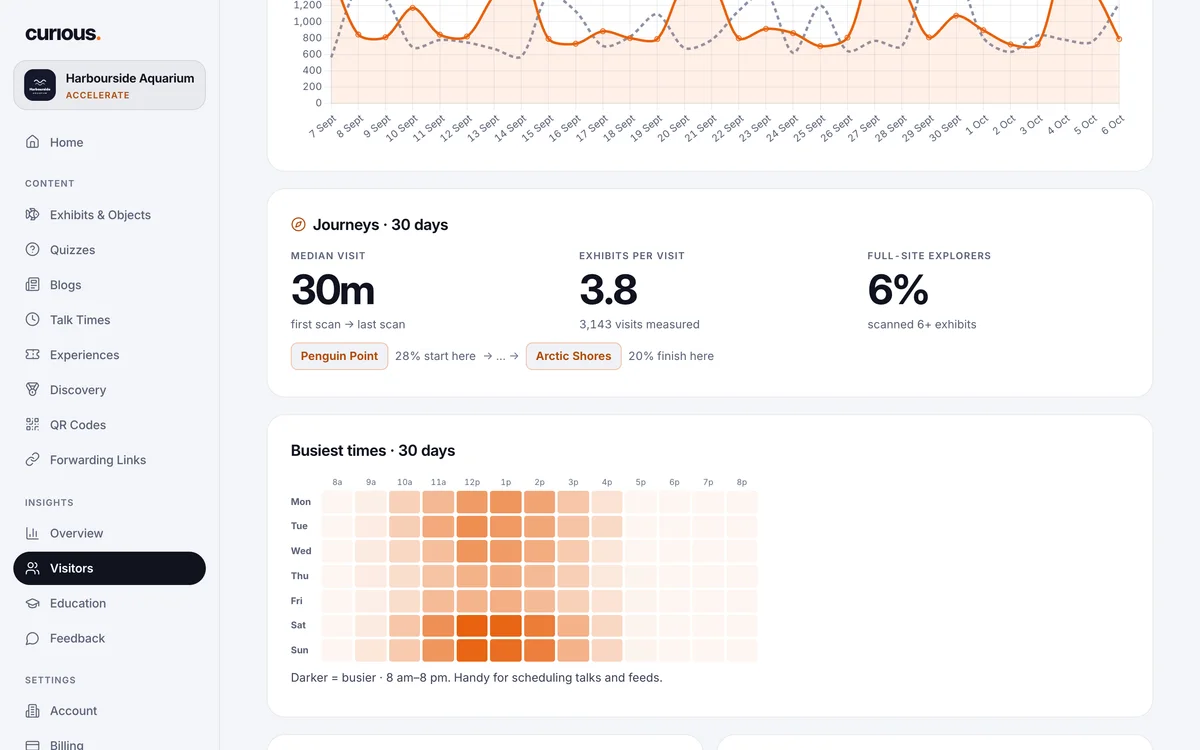
  • A busiest-times heatmap for every day of the week
  • A flag on the exhibits most visitors walk past, so you can check their signs
Journeys: a 30-minute median visit, 3.8 exhibits per visit, and the busiest-times heatmapJourneys: a 30-minute median visit, 3.8 exhibits per visit, and the busiest-times heatmap
Education view

What did they learn?

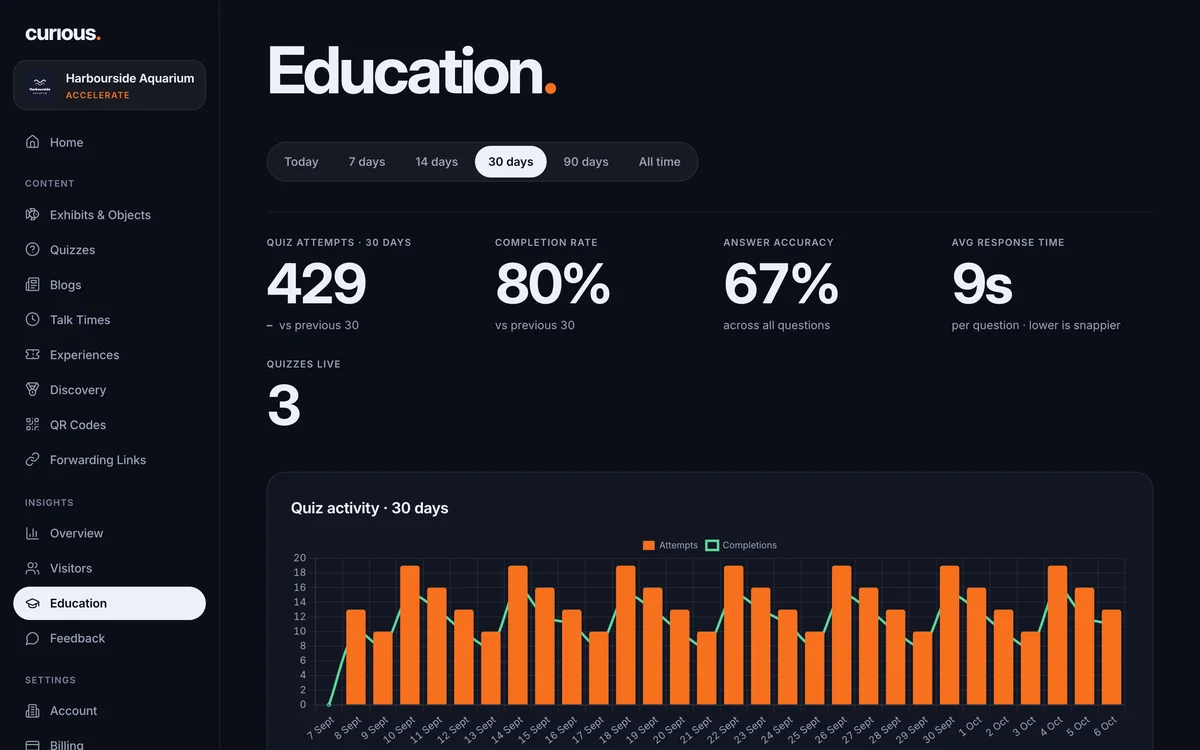
Quiz results arrive question by question, so you can see what landed and what didn’t.

  • Attempts, completions, accuracy and response time
  • Where players drop off, and the answer split per question
  • The five hardest questions across all your quizzes
  • Before-and-after scores when you pair a pre-visit quiz with a post-visit one
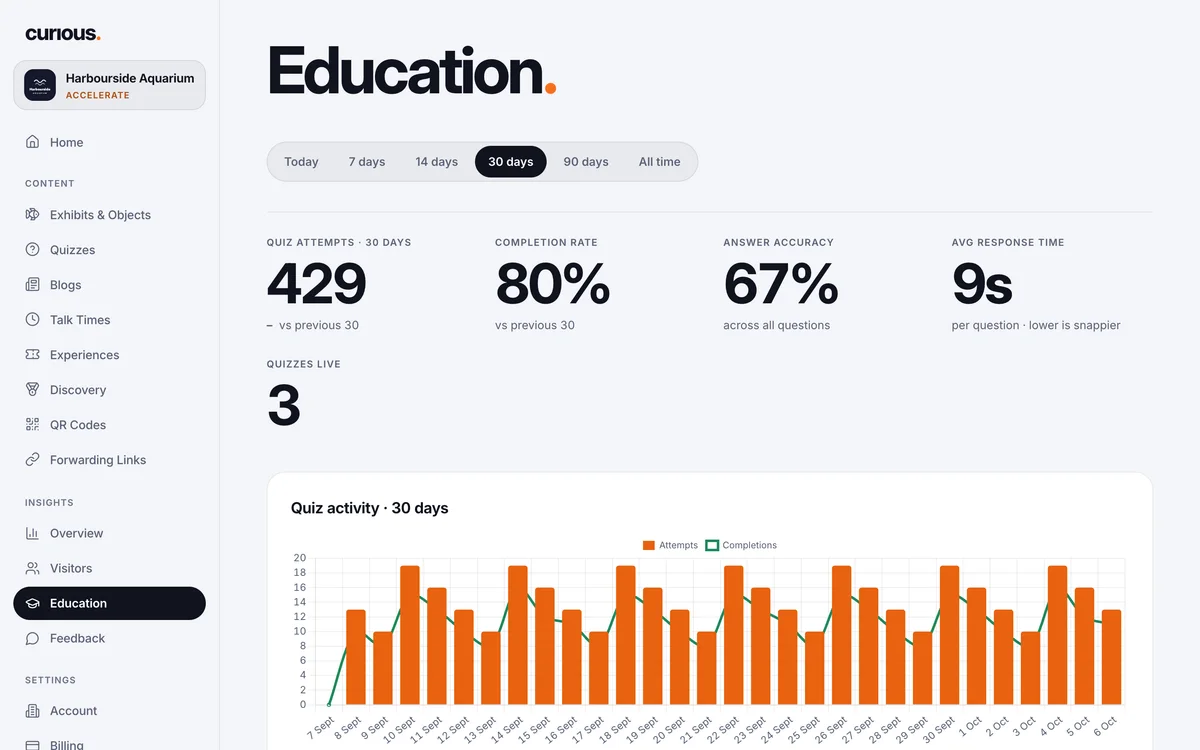
The Insights Education view: quiz attempts, completion rate, accuracy, response time, quizzes live and daily quiz activityThe Insights Education view: quiz attempts, completion rate, accuracy, response time, quizzes live and daily quiz activity
Exhibit drill-down

Which exhibits do visitors love?

Tap any exhibit for a page of its own.

  • Its views, and how it compares with the average
  • Its most-viewed and most-loved residents
  • Its busiest times and its quizzes
  • Any two exhibits side by side, from the Overview
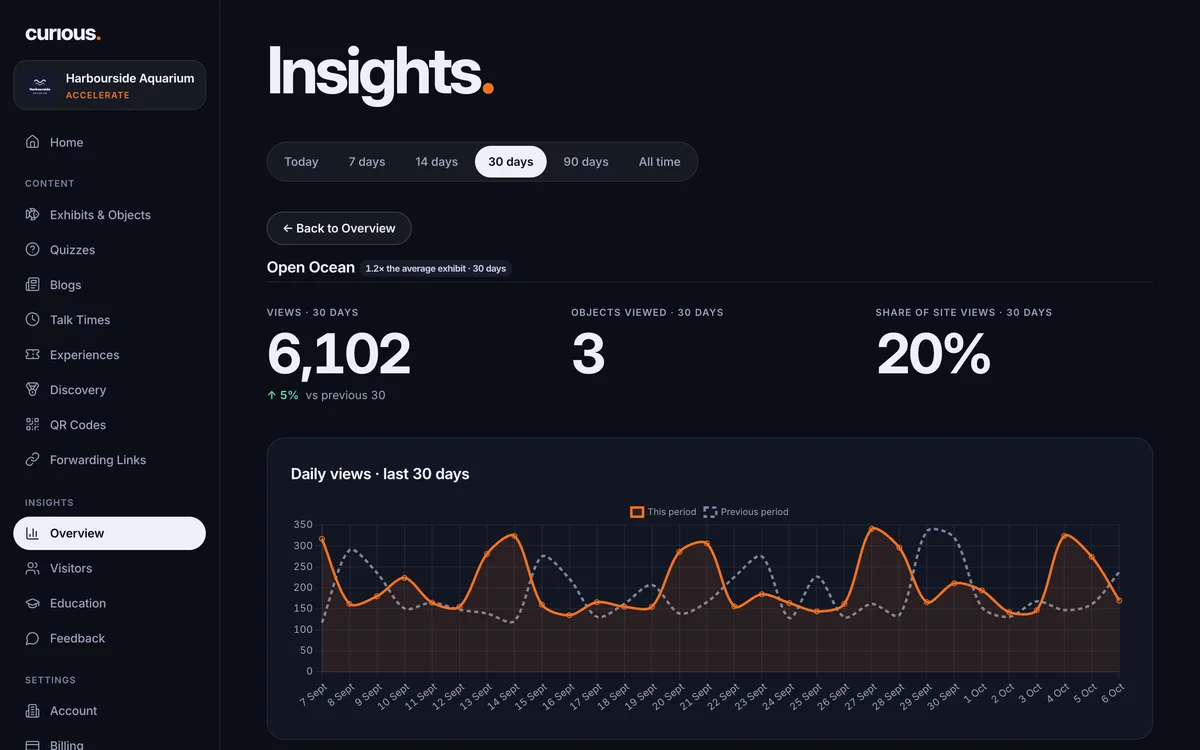
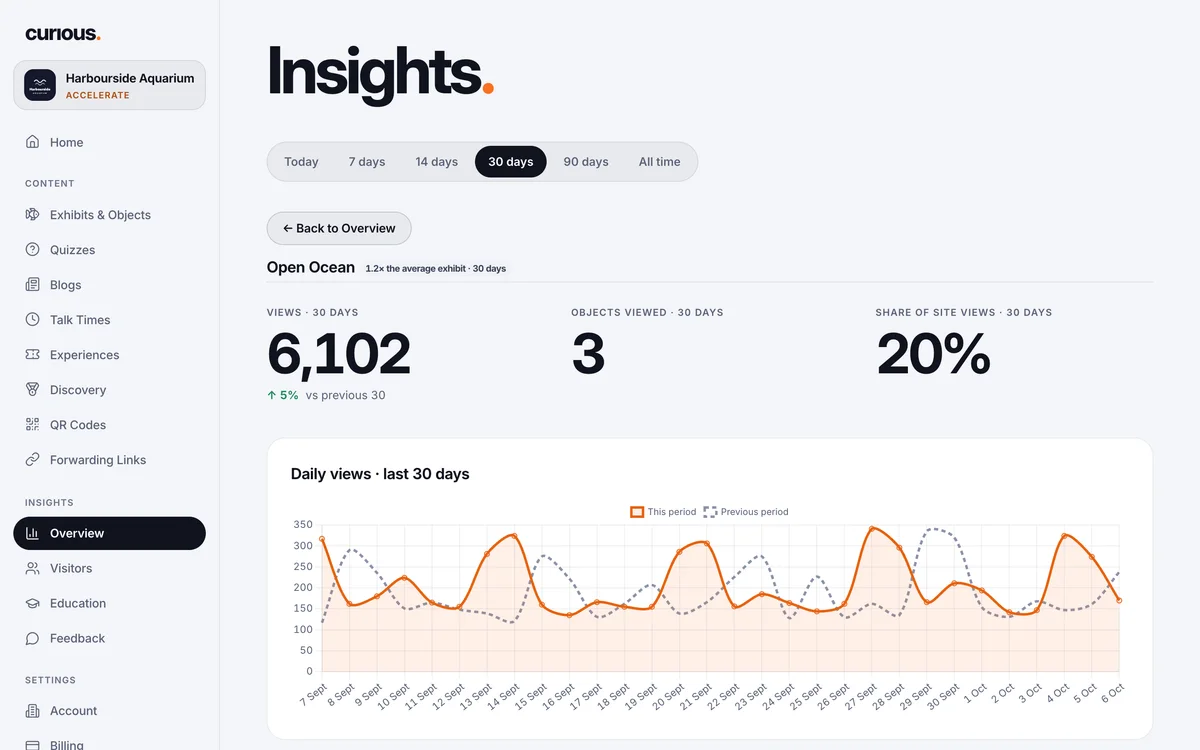
The Open Ocean drill-down: 1.2 times the average exhibit, its views, share of site views and daily viewsThe Open Ocean drill-down: 1.2 times the average exhibit, its views, share of site views and daily views
Visitor survey

Ask visitors what they thought.

Write your own questions and put the survey QR code wherever suits you: a sign by the exit, the café tables, the gift shop. Every answer appears in the Feedback view.

  • Responses and the average rating, with a 12-week trend
  • Low ratings waiting for a reply, until you mark them handled
  • Five-star comments queued up to feature
  • How many visitors answer each question
Data export

Take the numbers with you.

Each view downloads as a spreadsheet for your team or your trustees.

  • Visitors: one row for every page opened
  • Education: every quiz answer, right or wrong
  • Feedback: every survey response
  • The raw data, to browse in the portal
  • Or download it and run your own analytics in Excel
Every Monday

The Monday e-mail.

An automatic briefing in your inbox every Monday, with a summary of the last seven days.

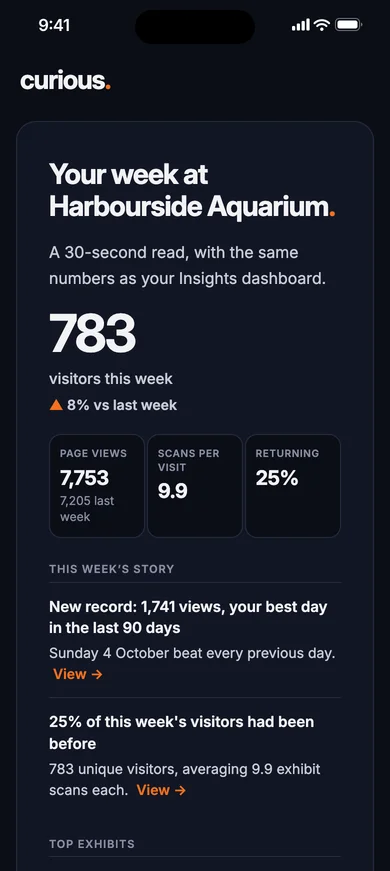
The Monday e-mail for Harbourside Aquarium: 783 visitors this week, up 8%, this week's story and the top three exhibits
  1. The headline.

    Visitors this week and the change on last week, in the subject line too.

  2. The detail.

    Page views against last week, scans per visit and the share of returning visitors.

  3. This week’s story.

    Up to four plain-English highlights, each with a link to your dashboard.

  4. Top exhibits.

    Your three most-viewed exhibits, then a button that opens Insights.

Discovery trails

What the trail tells you.

Each part of the treasure hunt has a figure in Insights.

  • Journeys

    A trail every day

    Exhibits per visit, where visits start and finish, and the exhibits few visitors reach.

  • Median visit length

    A progress ring

    First scan to last scan, the median across every visit measured.

  • Returning visitors

    Since your last visit

    The share of visitors who had been before, on the Overview and in Visitors.

  • Rewards claimed

    Rewards at the till

    The trail from scan to badge, zone, finished trail and reward claimed, with the badges earned most.

  • Quiz results

    Perfect Score

    Completion, accuracy and the answer split for every question, in Education.

Privacy

No names, no accounts.

Visitors never make an account and are never asked for a name or an e-mail address to use the guide. Insights is built from what is listed here.

Recorded

What the guide records.

Curious processes it for your site. You are the controller and we are the processor.

  • Each page opened: the time, the exhibit or animal, the browser’s language, the device, browser and operating system, the country and the network address
  • A first-party cookie holding a random ID for one year. It counts returning visitors and keeps their badges between visits
  • Quiz answers, upvotes, survey responses and experience clicks, against that random ID
Left out

What it leaves out.

And how long the rest is kept.

  • No accounts, and no name or e-mail address needed to use the guide
  • A survey keeps only what a visitor chooses to write
  • No other site sees your numbers. The comparison with other Curious sites is anonymous
  • Your content and analytics are deleted within 90 days of your subscription ending

On the Accelerate plan.

Full Insights comes with Accelerate, at £199 a month for the whole site. No setup fee and no contract.

Accelerate

Gain powerful insights and drive incremental revenue

£199a month

  • All features of Engage, plus:
  • Insights: visitors, education & exhibits
  • Accept donations from your visitors
  • Sell annual passes & experiences
  • Feedback & visitor surveys
Get started

No contract · Cancel any time

Discover is £79 a month and Engage is £129. Compare the three plans.

Find out what’s working.

Insights is free on the Accelerate plan. Start today, and your first Monday e-mail arrives in a week.